
‘Historic’ El Nino expected to have limited impacts locally
Trending
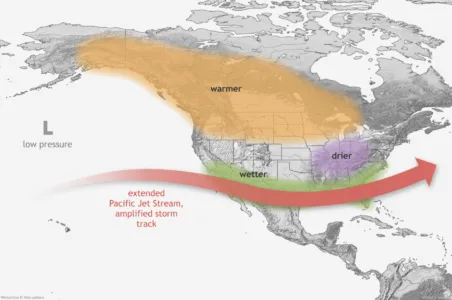
PHOTO PROVIDED/NOAA
A map of the U.S., Canada and Central and part of South America shows the effects of El Nino during winter in the Northern Hemisphere.
LOCK HAVEN -- Odds are decent that you've been hearing about the "super El Nino" weather phenomenon, and you might be unclear about what exactly that means for central Pennsylvania. There's a lot of clickbait, but when you get down to this part of the world, there is little actual information.
First of all, let's go over El Nino. Spanish for "the boy," the phenomenon is one of two matched patterns, with the other being named La Nina, for "the girl." The pair basically refer to the warming and cooling phases of various sections of the Pacific Ocean.
This is obviously a dramatic simplification, but, at a very high level, let's work with it.
One of the most common signals for an El Nino is the warming of a section of the equatorial Pacific Ocean. This warming produces a major change in how atmospheric circulation patterns function, which affects weather patterns across the globe either directly or indirectly, by way of different global weather systems interacting with one another. This is absolutely a situation where something happening on the other side of the world will affect Pennsylvania.
What's happening
Meteorologists are well-acquainted with El Nino signals, with at least 30 likely El Ninos recorded since 1900. With modeling techniques and advanced sensors, meteorologists quickly picked up on a very clear signal that this year would see the development of an El Nino.
In June, the National Oceanic and Atmospheric Administration, or NOAA, announced that El Nino was, in fact, forming.
This is typical -- El Nino and La Nina tend to form between April and June, reaching their maximum strength somewhere between October and February, before fading -- although in rare instances they can persist for a few years at most.
What is not typical is that the forming El Nino is already one of the strongest in recorded history -- with months left to intensify.
There are many ways to measure a phenomenon as complex as El Nino. One of the most well-known involves the Nino 3.4 index, which refers to one of the most common regions of the equatorial Pacific to examine: between the latitude/longitudes of 120-170W, 5S-5N.
According to a press release from June, NOAA "declares an El Nino has formed when temperatures in the equatorial Pacific are 0.5C above average for several consecutive months."
The C here, and in the future, denotes degrees Celsius.
An example baseline sea surface temperature in the 3.4 zone might be around 24 Celsius/75.2 Fahrenheit, per the Pacific Marine Environmental Laboratory at NOAA.
An increase of 1 degree Celsius is an increase of 1.8 degrees Fahrenheit.
In that June release, forecasters were predicting a 63% chance of temperatures in that region surpassing 2C, at which point the El Nino is considered to be very strong, or "super."
According to the International Research Institute for Climate and Society -- a program initially established jointly between NOAA and Columbia University -- the July monthly value for this El Nino, using the 3.4 index, was already at +2.03C.
They continue to note that in "the latest weekly Nino 3.4 index, centered on Aug. 12, 2026, reached +2.7C."
The strongest El Nino ever recorded by modern standards was the 2015-16 event, which saw the temperature anomaly reach +2.75C. It is estimated that the 1877 El Nino was roughly around the same strength.
Recorded Super El Ninos are the aforementioned 1877-78 and 2015-16 events, 1982-1983, 1997-1998 and 2023-24. Other Super El Ninos likely occurred historically, but, in the last 150 years, those five are the only ones recorded.
Now, keep in mind that El Nino doesn't stop strengthening until between October and February, and this year's El Nino is already basically as strong as the two other contenders for the title of the strongest El Nino in recorded history -- with months to go.
Where it's going
Meteorologists use advanced computer models, fed enormous amounts of data, to chart possible futures. Those models are then compressed into what are called ensembles -- groupings of forecasts.
If you have watched hurricane forecasts, you may have seen these referred to as "spaghetti models," since they sort of resemble a glob of spaghetti thrown at a map. Each individual line is a different ensemble member -- an individual model run resulting in a possible forecast.
If there is a tight spread, it indicates a lot of agreement from the different model numbers.
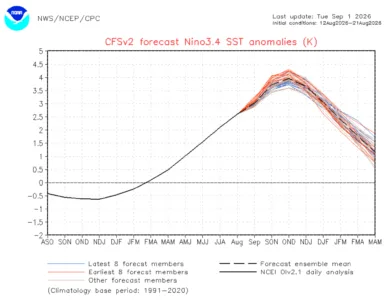
One such ensemble is NOAA's CFSv2, which consists of 40 ensemble members.
This is only one ensemble, and it is only one factor that meteorologists take into consideration.
However, for the CFSv2, the most conservative model is showing this El Nino peaking in strength in October-November-December, at +3.6C. The most aggressive outlier also shows a peak in October-November-December, at +4.3C. The ensemble's mean, found by considering all of the ensemble members together, comes in at just a tick under +4C.
This means that, at peak intensity, this model ensemble is currently predicting the sea surface temperatures in the 3.4 zone of the equatorial Pacific will reach 7.2 degrees Fahrenheit warmer than baseline.
What it means
That's a lot of information, and it's an incredibly simplified view. Experts in the field can get dramatically more in the weeds. This stuff is complicated!
Luckily, drawing conclusions is a lot simpler, because we have climatology -- the study of recorded data. This isn't foretelling and prognostication -- this is hard, experienced data; actual experienced conditions, from which conclusions can be drawn and guesses for 2027 can be made. The years of 2017-18 are the most recent neutral period, which will be used as a baseline.
NOAA has a weather station in Williamsport, but not Lock Haven -- while conditions are definitely not always the same in Williamsport as they are in Lock Haven, that is the closest data that is readily available.
Bear in mind, if you want to check the numbers, that we feel most of the effects of El Nino here in the autumn of the formation year and into the year after the actual weather phenomenon, as the residual heat lingers and continues to impact forecasts after dissipation -- especially for stronger El Ninos.
For example, if we are looking at data for 1983, that means that the warming period in the Pacific was the fall of 1982.
Breaking it down:
This is an example of a recent El-Nino-neutral baseline.
For 2017: In degrees Fahrenheit, 2017 was 2.1F warmer than average for the high temperatures and the low temperatures both -- resulting in a 2.1F warmer than average year. Williamsport received 2.91 additional inches of precipitation, and 0.4 inches more snow.
For 2018: In degrees Fahrenheit, 2018 was 0.1F cooler than average for the high temperatures, but 1.8F warmer than average for low temperatures -- resulting in a 0.8F warmer than average year. Williamsport received a whopping 26.50 inches of precipitation beyond the average, but 2.5 inches less snow. This made 2018 one of the wettest years on record in Williamsport.
This was due in part to training rains which produced rainfall over the same areas for a prolonged period of time, which is a weather pattern that we are seeing more of in general. However, 2018 also saw remnants from Tropical Storm Gordon and Hurricane Florence, as well as a snowless Nor'easter in October.
When those storm systems were not present, however, the region actually trended only slightly wetter than usual, with five months of the year seeing near-average or below-average precipitation.
Conclusion: The trend for 2017-18 was a neutral to slightly warmer period for temperatures, and conditions were generally a little wetter than the historical average, with 2018's severe rainfall impacts likely stemming from outliers.
1877
This El Nino is unfortunately before modern data recording. However, known historic effects include multiple famines which are attributed to roughly 50 million deaths, or about 3-4 percent of the entire global population in 1877. Some historical records indicate this year as "the year without a winter."
One such source is Minnesota's Dept. of Natural Resources, which notes in the Twin Cities, the average temperature from Dec.-Feb. 1877 was 29F, compared to a normal average of 19.6F across the same period.
1983
1983 saw temperatures -1.7F cooler than average. Williamsport saw +4.66 inches of precipitation, but -14.3 inches less snow than usual.
1998
1998 saw temperatures +1.7F warmer than average. Williamsport saw -3.38 inches of precipitation, with -18.9 fewer inches of snow.
2016
2016 saw temperatures +2.3F warmer than average. Williamsport saw -9.03 inches of precipitation, with -19.1 fewer inches of snow than usual.
2024
2024 saw temperatures +3.0F warmer than average. Williamsport saw +0.34 additional inches of precipitation, with -11.1 inches of snow.
To provide a few more data points, abbreviated, there were also strong El NInos -- not Supers -- in 1992 (-0.9F cooler than average, -2.43" precipitation, -7.4" snow); 1988 (-1.1F cooler than average, -9.30" precipitation, -13.7" snow); 1973 (-0.8F cooler than average, +6.23" precipitation, -7.4" snow); 1966 (-2.6F cooler than average, -5.38" precipitation, +14.5" snow); and 1957 (-2.5F cooler than average, +0.84" precipitation, +18.8" snow).
What to expect
From this, we can draw several conclusions for what we can expect 2027's weather to be locally, with an eye towards El Nino impacts. Out of nine data points, not counting 1877 since that's more of an historical curiosity than something there are numbers for:
-- 6 years saw cooler than average temperatures
-- 5 years saw lower than average precipitation
-- 6 years saw lower than average snowfall
Now, notably, the more recent El NIno years have trended warmer -- and the early forecasts for 2027 are indicating that trend to continue. This is likely due, in part, to the warmer planetary baseline observed over the last few decades.
Ultimately, climatology suggests a cooler and drier than normal year, with both less precipitation and notably less snow.
A major question mark is the warming trend in recent El Nino years, which also affects the precipitation we may receive -- warmer air is able to hold more moisture, which leads to more torrential rainfalls.
This will mean that while historical data suggests a cooler year, that should probably be adjusted to a slightly warmer than usual year in light of recent trends.
Also, it should be noted that these are, charitably, trends. Pennsylvania does not have a particularly strong El Nino signal compared to places such as the Southwest, for example, which see monsoon rains basically every El Nino.
While this El Nino will be historic, past data suggests that we will only experience mild effects in Pennsylvania.
An open, and looming, question remains, however: if the models' projections of a 4C peak hold true, what does an El Nino that much stronger than those previously experienced look like?
Perhaps the most concerning notion -- and the one that is likely driving much of the clickbait -- is that this El Nino could be so powerful that it fundamentally alters the planet's weather in some unforeseen way.
After all, it is a simple fact that nobody in living memory has experienced a weather phenomenon like this.
However, before there is too much doom and gloom, recall the Super El Nino of 1877 -- the one that starved 50 million people.
Scientists estimate that it was roughly similar in power to the El Nino of 2014-15.
Modern technology and logistics will mitigate most of the severe impacts in the United States. That doesn't mean that parts of the world won't suffer under the extreme event -- but it is unlikely quite the same level of catastrophe as 1877's El Nino managed.